Multiple Choice
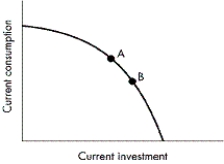
FIGURE 2-10

-Refer to Figure 2-10. Which of the following best explains how the society producing breadfruit and fish could have moved from curve AA to curve BB?
Definitions:
Related Questions
Q16: What will occur in the market when
Q19: A severe freeze has once again damaged
Q23: Flowcharts show activities,decision points,and the order of
Q26: What do economists mean when they state
Q67: Which of the following would NOT shift
Q80: Why is a production possibilities curve negatively
Q98: Steel producers offer to sell steel to
Q107: When Mom buys more Jell-O⁽™⁾ because the
Q112: Which of the following statements best describes
Q208: Why is economics different from a "hard"