Short Answer
Figure 1.2
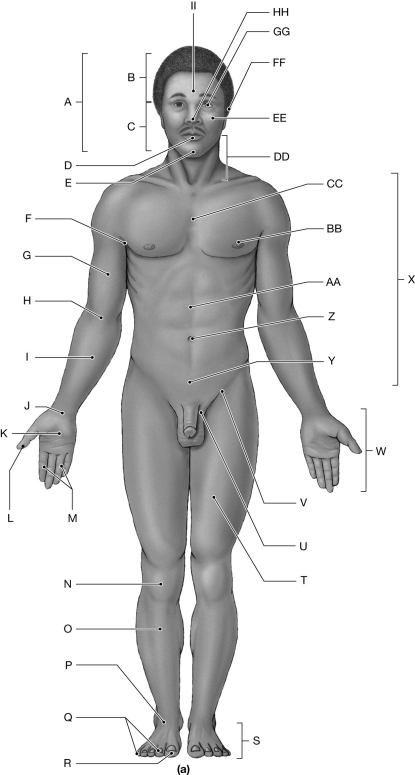
Using the figure above, identify the labeled part.
-Label R: ______________________________
Definitions:
Cumulative Frequency Distribution
A tabular summary of quantitative data showing the number of data values that are less than or equal to the upper class limit of each class.
Relative Frequency
The proportion of occurrences of a specific event compared to the overall amount of attempts or observations.
Nonoverlapping Classes
Categories or groups in a classification system where each member of the population belongs to one and only one group, ensuring distinct boundaries.
Cumulative Frequency
The sum of a series of frequencies, calculated by adding each frequency from a frequency distribution table to the sum of its predecessors.
Related Questions