Multiple Choice
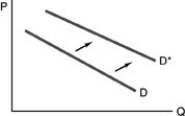
-Refer to the above figure. The arrows show the direction of a shift in the demand curve of Good A. Which of the following would be the most likely reason for the shift in the demand curve if Good A is an inferior good?
Definitions:
Related Questions
Q9: Refer to the above figure. At a
Q35: If one day a terrible disease were
Q87: Using the above table, at a price
Q92: The market clearing price of corn has
Q123: Refer to the above figure. Which diagram
Q129: Ways to ration goods include<br>A)first-come, first-served.<br>B)political power.<br>C)prices.<br>D)all
Q264: Refer to the above table. What is
Q300: Roses are more expensive on Valentine's Day
Q340: Suppose all prices increase by 10 percent
Q402: Suppose an individual experiences a permanent increase