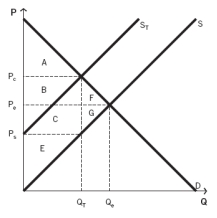
Use the following information to answer the next fifteen questions.
The following graph depicts a market where a tax has been imposed. Pₑ was the equilibrium price before the tax was imposed, and Qₑ was the equilibrium quantity. After the tax, PC is the price that consumers pay, and PS is the price that producers receive. QT units are sold after the tax is imposed. NOTE: The areas B and C are rectangles that are divided by the supply curve ST. Include both sections of those rectangles when choosing your answers.

-Which areas represent consumer surplus before the tax is imposed?
Definitions:
Inequality
An inequality is a mathematical statement indicating that two expressions are not equal, utilizing symbols like <, >, ≤, or ≥ to denote the relationship between them.
Inequality
A mathematical statement indicating that two expressions are not equal, employing symbols such as <, >, ≤, or ≥ to show the relationship.
Absolute Value Inequality
An inequality that involves the absolute value of a variable expression, requiring consideration of both positive and negative solutions.
Set Notation
A mathematical notation used for describing a collection of distinct objects, typically in the form of {a, b, c,...}.
Q6: Quality changes:<br>A) are easily accounted for in
Q15: The government has been considering doing away
Q83: The government can assist in reducing the
Q84: A real-life example of a binding price
Q94: A(n) _ in the elasticity of supply
Q103: With all else being constant,how do the
Q112: In a particular nation,people buy a completely
Q128: You know that the consumer price index
Q136: Refer to the table below.If the price
Q140: You are given the following information about