Use the following information to answer the next fifteen questions.
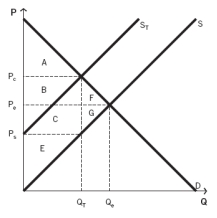
The following graph depicts a market where a tax has been imposed. Pₑ was the equilibrium price before the tax was imposed, and Qₑ was the equilibrium quantity. After the tax, PC is the price that consumers pay, and PS is the price that producers receive. QT units are sold after the tax is imposed. NOTE: The areas B and C are rectangles that are divided by the supply curve ST. Include both sections of those rectangles when choosing your answers.

-Which areas represent producer surplus after the tax is imposed?
Definitions:
Q2: Suppose you live in a community with
Q24: The natural rate of unemployment is:<br>A) the
Q29: Refer to the accompanying diagram.An increase in
Q72: You are the president of the United
Q74: According to the March 2012 consumer price
Q90: Of the following items,which is (are) most
Q106: The table below shows the maximum number
Q108: _ is a real-life example of a
Q110: Which statement best describes the opportunity cost
Q139: Which of the following two types of