Use the following information to answer the next fifteen questions.
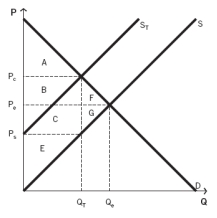
The following graph depicts a market where a tax has been imposed. Pₑ was the equilibrium price before the tax was imposed, and Qₑ was the equilibrium quantity. After the tax, PC is the price that consumers pay, and PS is the price that producers receive. QT units are sold after the tax is imposed. NOTE: The areas B and C are rectangles that are divided by the supply curve ST. Include both sections of those rectangles when choosing your answers.

-Which areas represent the amount of producer surplus lost due to the tax?
Definitions:
Income
Refers to the money received, especially on a regular basis, for work or through investments.
Normal Goods
Goods for which demand increases as consumer income rises, and falls when consumer income decreases, opposite to inferior goods.
Inferior Goods
Goods whose demand decreases as the income of consumers increases, in contrast to normal goods.
Income
Income generated regularly from employment or investments.
Q13: Why do economists use models?<br>A) Models are
Q16: You are considering the "dress well,test well"
Q46: When supply shifts right and demand shifts
Q49: If the price of industrial plastic injection
Q49: Which of the following individuals would NOT
Q61: Zero unemployment:<br>A) is only possible in recessions.<br>B)
Q63: If the local government tells gas stations
Q111: The percent change in the overall level
Q111: If the price of a good increases,holding
Q115: The main statistic that is used to