Use the following graph to answer the following questions.This graph depicts an economy where aggregate demand has decreased,with no change in either short-run aggregate supply (SRAS) or long-run aggregate supply (LRAS) .
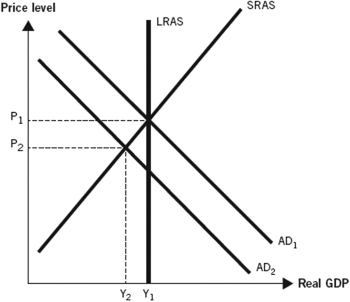
-The graph accurately summarizes what happened during the Great Depression,because during that time,the price level ________ and real gross domestic product (GDP) ________.
Definitions:
Variables
Elements or factors that can be changed and measured within a scientific experiment.
Negative Correlation
A statistical relationship between two variables such that as one variable increases, the other decreases.
Psychological Disorder
Deviant, distressful, and dysfunctional patterns of thoughts, feelings, and actions.
Degree of Wealth
A measure of the amount of financial assets or resources that an individual, family, or organization possesses.
Q30: Explain the difference between investment and net
Q58: Explain and illustrate how the short-run and
Q74: In 2007,per capita real gross domestic product
Q76: An increase in _ would lead to
Q85: If Bank of Mateer has a required
Q88: Where marginal propensity to consume is denoted
Q92: Suppose an economy has a law that
Q111: A severe drought hits a country and
Q120: The Coppock Bank began the day with
Q122: Between 2006 and 2010,per capita real gross