Use the following graph to answer the following questions.The graph depicts an economy where aggregate demand has decreased.Note that long-run aggregate supply remains changed.
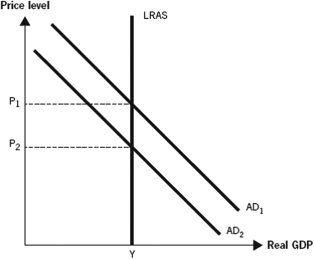
-The graph shows a decrease in the price level due to a decrease in aggregate demand.Real gross domestic product (GDP) ,however,does not change.The best explanation for the events depicted on this graph is that
Definitions:
Q6: Supply-side fiscal policy initiatives take a long
Q42: An increase in the value of the
Q45: Which of the following aggregate demand-aggregate supply
Q67: An increase in the price level that
Q74: A bank has excess reserves of $1,000,000
Q96: During the Great Depression,the aggregate price level
Q118: During the Great Recession,_ caused aggregate demand
Q122: Which country holds the most U.S.debt?<br>A) China<br>B)
Q123: If the economy begins to fall into
Q126: Suppose the majority of students who are