THE NEXT QUESTIONS ARE BASED ON THE FOLLOWING INFORMATION:
From the top 1000 companies in valuation,a comparison of the mean dividend yield of the top and bottom ten electric utility companies is desired.Let 1 = top ten,and 2 = bottom ten,electric utility companies respectively.The data shown below are for two independent samples,which are drawn at random from populations that are normally distributed.
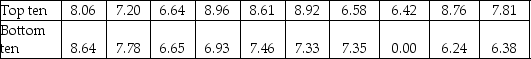
-Using results of Excel or Minitab to conduct a two-sample t-test for data in the table above,test
H0 : μ1 - μ2 = 0 vs.H1 : μ1 - μ2 ≠ 0 at the 5% significance level.What is your conclusion?
Definitions:
Test Power
The probability that a statistical test will correctly reject the null hypothesis when it is false, indicating a test's effectiveness.
False Null Hypothesis
Incorrect rejection of a true null hypothesis, often referred to as a Type I error in statistical hypothesis testing.
Confidence Interval
An encompassing array of values, from sample data statistics, perceived to contain the unknown value of a population parameter.
Population Mean
The average of all the values in a population, representing the central tendency.
Q16: Calculate the value of MSR.<br>A)3.00<br>B)0.049<br>C)0.016<br>D)9.26<br>
Q19: What are the null and alternative hypotheses
Q20: What is the most accurate estimate of
Q21: A multiple regression model has the form
Q51: Hypothesis tests that use the F distribution
Q92: The test for the equality of two
Q105: What is the value of the test
Q114: Find the upper confidence limit of the
Q179: A regression analysis between weight (y in
Q214: Which of the following is the value