THE NEXT QUESTIONS ARE BASED ON THE FOLLOWING INFORMATION:
From the top 1000 companies in valuation,a comparison of the mean dividend yield of the top and bottom ten electric utility companies is desired.Let 1 = top ten,and 2 = bottom ten,electric utility companies respectively.The data shown below are for two independent samples,which are drawn at random from populations that are normally distributed.
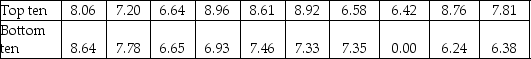
-Using results of Excel or Minitab to conduct a two-sample t-test for data in the table above,test
H0 : μ1 - μ2 = 0 vs.H1 : μ1 - μ2 ≠ 0 at the 5% significance level.What is your conclusion?
Definitions:
Whole Number
A numerical value without fractions or decimals, often used to count discrete objects.
Fraction
A mathematical expression representing the division of one integer by another, typically used to denote a part of a whole.
Fraction
A mathematical expression representing the division of one integer by another.
Equals
Signifies mathematical equality; used to denote that two values are the same.
Q41: State the null hypothesis.<br>A)H<sub>0</sub> : P<sub>x</sub> =
Q53: In developing an interval estimate for a
Q69: Interpret the estimate b<sub>4</sub>.
Q92: The test for the equality of two
Q95: When testing for the differences between the
Q120: In multiple regression analysis,a residual is the
Q135: Interpret the estimated regression coefficient b<sub>2</sub>.
Q149: In the context of this problem,explain why
Q228: In a multiple regression analysis,six independent variables
Q243: The test on all parameters of a