THE NEXT QUESTIONS ARE BASED ON THE FOLLOWING INFORMATION:
The following data were generated from a matched pairs experiment.
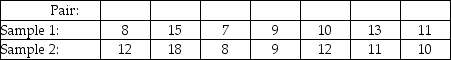
-State the appropriate null and alternative hypotheses to determine whether the two population means differ at 10% significance level.
Definitions:
Total Cost Curve
A graph that shows the total cost incurred by a firm in the production of goods or services at different levels of output.
Diminishing Returns
The principle stating that if one factor of production is increased while others remain constant, the overall returns will eventually decrease after a certain point.
Marginal Cost Curve
A graphical representation showing how the cost of producing one additional unit of a good changes as the production volume varies.
Total Product
The overall quantity of output that a firm produces, typically measured within a specific time period under given levels of input.
Q9: Suppose that the sample regression equation of
Q16: The Discovery Automobile Company is attempting to
Q31: In a recent market research survey,college students
Q33: Which of the following is the value
Q39: What is the most accurate conclusion regarding
Q71: The concept of margin of error is
Q141: What is the test statistic for this
Q145: Determine the coefficient of multiple correlation.<br>A)0.42<br>B)0.82<br>C)0.73<br>D)0.91<br>
Q170: If a dummy variable for gender is
Q202: The coefficient of determination is often interpreted