THE NEXT QUESTIONS ARE BASED ON THE FOLLOWING INFORMATION:
An economist is in the process of developing a model to predict the price of gold.She believes that the two most important variables are the price of a barrel of oil (x1)and the interest rate (x2).She proposes the model y = β0 + β1x1 + β2x2 + β3x1x3 + ε.A random sample of 20 daily observations was taken.The computer output is shown below.
THE REGRESSION EQUATION IS
y = 115.6 + 22.3x1 + 14.7x2 - 1.36x1x2
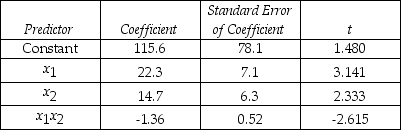
S = 20.9 R-Sq = 55.4%
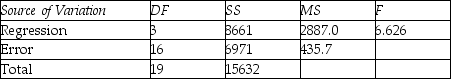
ANALYSIS OF VARIANCE
-In the regression model Y = β0 + β2X1 + β2X2 + ε,the extent of any multicollinearity can be evaluated by finding the correlation between X2 and X2 in the sample.Explain why this is so.
Definitions:
Frequency Polygon
A graphical representation of the distribution of a data set, using a line graph to connect midpoints of intervals.
Bar Chart
A graphical representation of data using bars of different heights or lengths to show the values of various categories.
Frequency Distribution
A summary of how often each value in a set of data occurs, typically presented in a table or graphically as a histogram.
SAT Math Scores
Quantitative data reflecting individuals’ performance on the mathematics section of the SAT examination.
Q26: What would we expect the total dollar
Q54: One of the benefits of the sign
Q59: The model y<sub>t</sub> = 10 + 4.5x<sub>t</sub><sub>
Q72: How would you interpret the coefficient on
Q82: Suppose that the true linear model for
Q86: When x<sub>1</sub> increases by 5,what is the
Q112: In multiple regression analysis,it is possible that
Q134: The coefficient of multiple correlation R measures
Q174: In a one-way ANOVA,all populations' variances are
Q213: Data were collected regarding the amount of