THE NEXT QUESTIONS ARE BASED ON THE FOLLOWING INFORMATION:
The table below is the data set of the Shiller Real Home Price Index for the years 1934-1944.
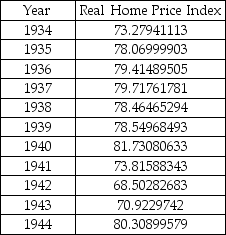
-If the forecaster uses an exponential smoothing constant of 0.8,show the steps involved in calculating the forecast for the year 1935.
Definitions:
Net Revenue
The total amount of income generated from sales or services after subtracting returns, allowances, and discounts.
Poisson Distribution
A discrete probability distribution that expresses the probability of a given number of events occurring in a fixed interval of time or space, given the average number of times the event occurs over that interval.
Binomial Distribution
A probability distribution that summarizes the likelihood that a variable will take one of two independent values under a given set of parameters or assumptions.
Tornado Chart
A type of bar chart used in sensitivity analysis to compare the relative importance of different variables.
Q2: Which of the following social issues would
Q8: A chi-square test for independence is applied
Q11: How do companies conduct a social audit?<br>A)
Q18: Higher productivity results in higher costs and
Q23: Find a 95% confidence interval for the
Q24: Assume that you are a business owner
Q34: Unethical behavior is defined as behavior that
Q53: Supply refers to how much of a
Q64: After the seasonality component is removed in
Q127: Which of the following is the value