Essay
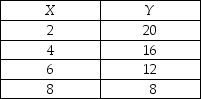
-Graph the data in the table above in the figure. Label the axes.
a) Is the relationship between X and Y positive or negative?
b) What is the slope when X = 4?
c) What is the slope when X = 8?
Definitions:
Related Questions
Q23: An opportunity cost of economic growth is<br>A)
Q95: The loss of the highest-valued alternative defines
Q200: The most anyone is willing to pay
Q222: To graph a relationship that involves more
Q255: Betty and Ann live on a desert
Q315: As we move along a bowed-out production
Q395: Scarcity is a situation in which<br>A) people
Q418: Employees at Bank of America are good
Q422: The opportunity cost of more capital goods
Q474: The vertical axis in a graph<br>A) is