Multiple Choice
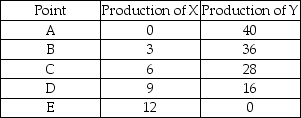
-The above table shows production combinations on a country's production possibilities frontier. What is the opportunity cost of one unit of Y when the production of good Y increases from 16 to 28 units?
Definitions:
Related Questions
Q24: If there is a direct relationship between
Q39: The graph of two variables,x and y,is
Q70: When the production possibilities frontier bows outward
Q128: Which of the following does NOT help
Q156: In the figure above,moving from production at
Q168: In the figure above,suppose the price of
Q183: In the table above,country B is producing
Q287: In a graph,a line has a negative
Q416: The statement "Managers with a college education
Q426: Which of the following is consistent with