Multiple Choice

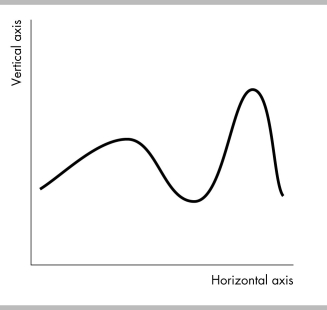
-A time-series graph showing total production in Japan from 1960 to 2010 shows a positive trend. It is the case that total production
Definitions:
Related Questions
Q16: The multiplier effect<br>A) is nonexistent in the
Q17: Suppose the population of Tiny Town is
Q55: During a recession,people drop out of the
Q56: If the economy is at full employment,<br>A)
Q178: In 2012,of the following _ had the
Q182: In an economy,43 million people are employed,3
Q199: Suppose that over a period of years
Q327: An economist says: "The supply curve has
Q345: Discouraged workers _ counted as officially unemployed
Q505: Your friend Tony opened a pizzeria.You helped