Multiple Choice
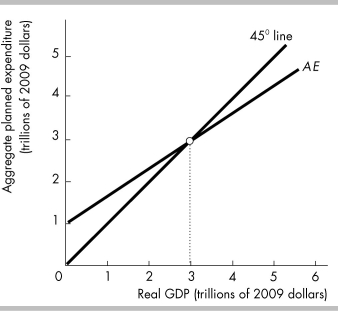
-The figure shows Tropical Isle's aggregate planned expenditure curve. When aggregate planned expenditure is $2 trillion, aggregate planned expenditure is ________ than real GDP, firms' inventories ________, and firms ________ their production.
Definitions:
Related Questions
Q121: If there are no income taxes or
Q122: Suppose disposable income increases from $7 trillion
Q184: Using the data in above table,the marginal
Q227: The MPC and MPS<br>A) sum to 1.<br>B)
Q242: In Japan in 2000 the price level
Q259: In the short-run,a decrease in government expenditure
Q281: When disposable income increases from $7 trillion
Q284: Suppose that the slope of the AE
Q309: An economy has no imports and no
Q340: Full-employment equilibrium occurs when<br>A) real GDP exceeds