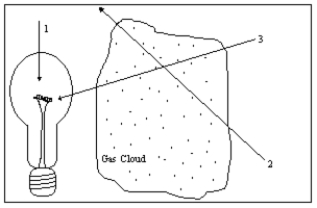
-Diagram 6-2 illustrates a light source, a gas cloud, and three different lines of sight. Along which line of sight would an observer see a continuous spectrum
Definitions:
Variance
A measure of the dispersion or spread of a set of data points around their mean value, indicating how much the data points differ from the average.
Standard Deviation
A calculation that quantifies the extent of deviation or spread within a group of data points.
Sample Variance
A measure of how datapoints in a sample are spread out from their sample mean, quantifying the extent of variation within the sample.
Kurtosis
A measure of the "tailedness" of the probability distribution of a real-valued random variable; high kurtosis indicates a distribution with heavy tails and a sharp peak, while low kurtosis indicates a flatter distribution.
Q14: When it is winter in the northern
Q28: The book "De Revolutionibus Orbium Coelestium"<br>A)describes how
Q34: Stellar parallax is used to measure distances
Q66: If a planet orbits the Sun at
Q71: How is a luminosity class assigned to
Q75: The _ is a measure of the
Q82: A zero Kelvin temperature is also known
Q134: Which wavelength band uses observatories on aircraft<br>A)ultraviolet<br>B)visual<br>C)infrared<br>D)X-ray
Q135: The central cores of which type of
Q151: Consider a two-body system of the Earth