The negative velocity numbers in the following graph represent a galaxy that is moving away from us. 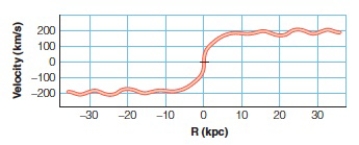
Definitions:
Spectroscopic Data
Information obtained from analyzing the interaction between electromagnetic radiation and matter, used to determine chemical composition and structure.
Infrared Spectrum
A spectrum representing the infrared absorption or emission by a substance, used to identify chemical functionalities and molecular structure.
Mass Spectrum
A plot or record that shows the distribution of ions by mass in a sample, used to determine the composition of a substance.
Base Peak
In mass spectrometry, the most intense peak representing the ion that is the most abundant.
Q9: How is Earth's magnetic field generated
Q28: Jupiter's _ and _ are the ingredients
Q57: Triton has a retrograde orbit around Neptune.
Q60: The lowest-mass stars cannot become giants because<br>A)they
Q63: In the lighthouse model shown above, the
Q89: What property do greenhouse gases have that
Q92: Seyfert galaxies are spiral galaxies with active
Q93: Observations in the infrared have detected a
Q112: Stars with masses between 0.4- <img src="https://d2lvgg3v3hfg70.cloudfront.net/TB5757/.jpg"
Q140: Supermassive black holes are believed to be