Exhibit 1A-2 Straight line
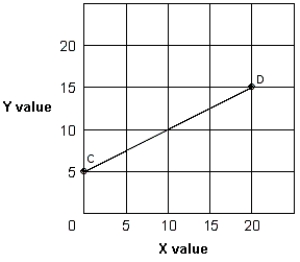
-In Exhibit 1A-2, the slope of straight line CD is:
Definitions:
Minitab Output
The resultant data and graphs produced by Minitab, a statistical analysis software, after performing specified analyses.
Coefficient of Determination
A statistical measure, often denoted R², that represents the proportion of variance in the dependent variable predictable from the independent variable(s).
Coefficient of Correlation
A measure that indicates the extent to which two variables change together. If the value is close to 1 or -1, it indicates a strong relationship between the variables.
Random Sample
A subset of a population selected in such a manner that every individual has an equal chance of being chosen.
Q18: Assuming an inflationary gap exists,classical economists believe
Q55: Demand curves slope downward to the right.
Q69: If input prices increase,the supply curve for
Q79: Human wants:<br>A) are unfilled only in the
Q84: In Exhibit 2-5,movement between which of the
Q101: According to the law of demand,when will
Q111: Assume that Coca-Cola and Pepsi-Cola are substitutes.A
Q161: When economists say scarcity,they mean:<br>A) there are
Q186: If two goods are substitutes in consumption,a(n):<br>A)
Q244: The curve that shows the relationship between