Multiple Choice
Exhibit 1A-6 Straight line 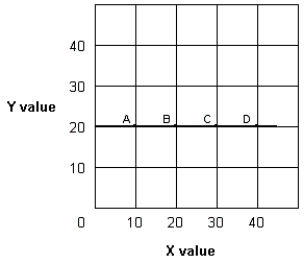
-In a graphic relationship, shifts in a curve are caused by a change in:
Definitions:
Related Questions
Q40: An analysis of production possibilities curves indicates
Q45: If pork and beans is an inferior
Q61: All of the following are examples of
Q68: The supralittoral zone of the rocky shore
Q71: Opportunity cost:<br>A) represents the best alternative sacrificed
Q88: Policies to create jobs in the nation
Q122: The law of demand says that the
Q140: A leftward shift of a supply curve
Q150: Marginal analysis examines the effects of additions
Q175: Assume that crackers and soup are complementary