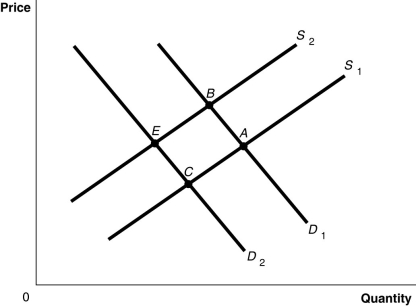
Figure 3-8

-Refer to Figure 3-8.The graph in this figure illustrates an initial competitive equilibrium in the market for motorcycles at the intersection of D₁ and S₁ (point A) If the price of motorcycle engines increases, and the wages of motorcycle workers increase, how will the equilibrium point change?
Definitions:
Potential Markets
Describes segments or groups of consumers that a business has not yet served but could potentially engage and sell its products or services to.
Due Diligence Reports
Comprehensive assessments conducted to evaluate the business’s legal, financial, and operational status before entering into an agreement or transaction.
Investment Proposals
Documents that outline detailed plans for spending capital with the intent of generating returns or profits.
Informational Reports
Reports aimed at providing facts and data without rendering opinions or recommendations.
Q19: Which term refers to a legally established
Q160: Refer to Figure 3-7.Assume that the graphs
Q176: Which of the following statements about an
Q207: Economists working for Uber,along with economists from
Q263: Refer to Figure 4-15.If,because of an externality,the
Q281: Refer to Figure 4-2.What area represents the
Q291: Refer to Figure 3-2.An increase in the
Q348: Suppose that in Belgium,the opportunity cost of
Q401: Holding everything else constant,a decrease in the
Q421: In much of Europe,the legal age to