Multiple Choice
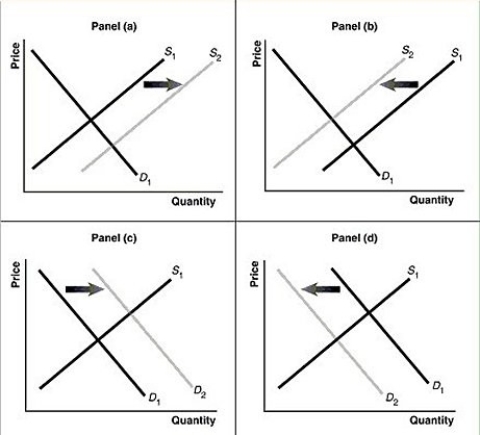
Figure 3-7

-Refer to Figure 3-7.Assume that the graphs in this figure represent the demand and supply curves for women's clothing.Which panel best describes what happens in this market when the wages of seamstresses rise?
Definitions:
Related Questions
Q11: The cities of Francistown and Nalady are
Q14: Refer to Figure 4-7.The figure above represents
Q109: Assume that both the demand curve and
Q221: Refer to Table 4-3.The table above lists
Q261: What is the difference between an "increase
Q315: Refer to Figure 3-6.The figure above represents
Q317: A price ceiling is a legally determined
Q367: Assume that the price for lawn care
Q369: Which of the following is a flow
Q398: "An Inquiry into the Nature and Causes