Multiple Choice
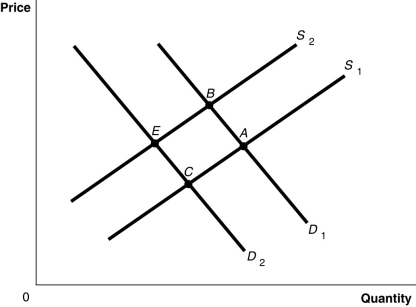
Figure 3-8

-Refer to Figure 3-8.The graph in this figure illustrates an initial competitive equilibrium in the market for apples at the intersection of D₁ and S₁ (point A) . If there is a shortage of apples, how will the equilibrium point change?
Definitions:
Related Questions
Q61: Refer to the Article Summary.If the STRONGER
Q96: If the demand for a product decreases
Q155: In economics,the term "free market" refers to
Q177: Discuss the correct and incorrect economic analysis
Q204: Private costs<br>A) are borne by producers of
Q249: The difference between the highest price a
Q267: Explain the differences between a change in
Q315: Refer to Figure 3-6.The figure above represents
Q349: If a nation changes its laws to
Q419: If,for a product,the quantity supplied exceeds the