Multiple Choice
Figure 4-3 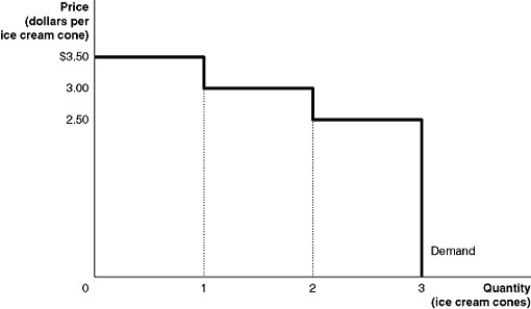 Figure 4-3 shows Kendra's demand curve for ice cream cones.
-Refer to Figure 4-3. If the market price is $3.00, what is the consumer surplus on the second ice cream cone?
Definitions:
Related Questions
Q9: Economic efficiency in a competitive market is
Q72: Refer to Figure 4-18.What does S₁ represent?<br>A)
Q117: Refer to Figure 4-8.Suppose that instead of
Q135: How can improvements in health increase a
Q211: Refer to Figure 4-1.If the market price
Q220: If the demand curve for a product
Q220: Refer to Table 4-3.The table above lists
Q290: Refer to Figure 3-5.In a free market
Q409: Refer to Figure 4-10.Suppose that instead of
Q468: Refer to Figure 3-4.At a price of