Essay
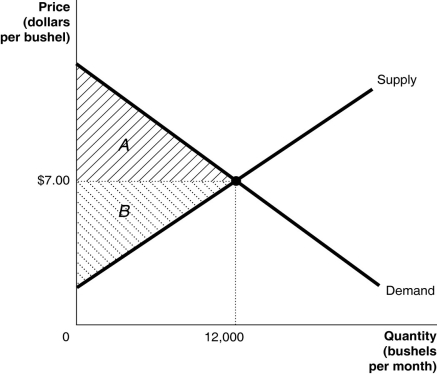
The graph below represents the market for alfalfa.The market price is $7.00 per bushel.Identify the areas representing consumer surplus,producer surplus,and economic surplus.
Definitions:
Related Questions
Q6: Refer to Table 4-7.If a minimum wage
Q28: Consider a used car market in which
Q44: Which of the following activities create a
Q178: It is possible for a market for
Q194: As the number of firms in a
Q273: Refer to Figure 4-3.If the market price
Q310: Refer to Figure 3-7.Assume that the graphs
Q353: The graph below represents the market for
Q427: Refer to Table 4-6.The table above lists
Q455: Which of the following would cause a