Figure 4-18
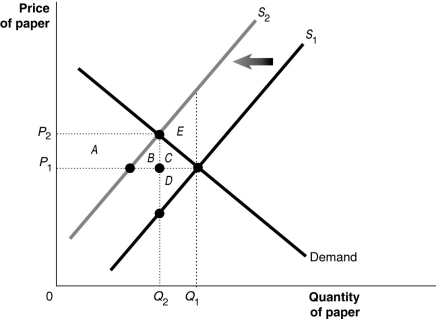 Suppose there are several paper mills producing paper for a market. These mills, located upstream from a fishing village, discharge a large amount of wastewater into the river. The waste material affects the number of fish in the river and the use of the river for recreation and as a public water supply source. Figure 4-18 shows the paper market. Use this Figure to answer the following question(s) .
-Refer to Figure 4-18.What does S₂ represent?
Definitions:
Increasing-Cost Industry
An industry in which the costs of production increase as the industry grows and decreases as it contracts.
Resource Prices
The costs associated with acquiring inputs used in the production process, such as labor, materials, and capital.
Industry Expands
The process of growth within a particular sector or industry, marked by increased production, innovation, and possibly the entrance of new firms.
Economic Profits
The difference between a firm's total revenues and its total costs, including both explicit and implicit costs, representing the excess return over the firm's opportunity costs.
Q21: Economists generally favor the use of tradable
Q27: The efficient level of paper production will
Q126: Refer to Figure 4-5.The figure above represents
Q139: Insurance companies use deductibles and coinsurance to
Q209: Who hires the managers of a corporation?<br>A)
Q235: Refer to Figure 5-1.The efficient equilibrium price
Q375: Let D = demand,S = supply,P =
Q383: Included on the board of directors of
Q433: Deadweight loss refers to a loss in
Q474: Refer to Figure 3-8.The graph in this