Figure 7-2
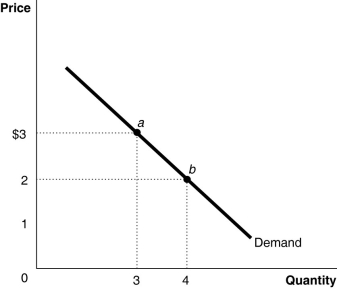 Figure 7-2 represents the demand for ice cream cones.
-Refer to Figure 7-2.When the price of ice cream cones increases from $2 to $3,quantity demanded decreases from 4 ice cream cones to 3 ice cream cones.This change in quantity demanded is due to
Definitions:
Demand
The quantity of a particular good or service that consumers are willing and able to purchase at various prices during a given period of time.
Negatively Sloped
Describes a line or curve on a graph that moves downwards as it moves from left to right, indicating an inverse relationship between two variables.
Total Surplus
The sum of consumer surplus and producer surplus in a market, representing the total benefits to society from the production and consumption of goods or services.
Demand
The quantity of a product or service that consumers are willing and able to purchase at various prices over a given period of time.
Q14: Refer to Table 7-12.Based on the data
Q24: Refer to Figure 7-10.Using the total revenue
Q60: An increase in liabilities will reduce a
Q104: The law of diminishing marginal utility states
Q120: In general,a "big ticket item" such as
Q189: Which of the following statements is false?<br>A)
Q240: Refer to Figure 8-5.The vertical difference between
Q323: If a firm has implicit costs as
Q350: Refer to Figure 7-6.Using the midpoint formula,calculate
Q409: You have a bond that pays $125