Multiple Choice
Figure 10-6
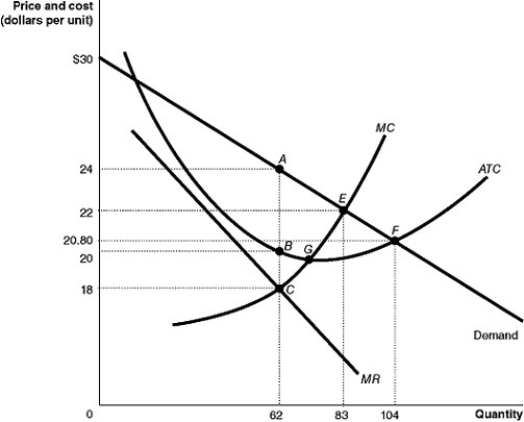 Figure 10-6 shows the cost and demand curves for a monopolist.
-Refer to Figure 10-6.The monopolist earns a profit of
Definitions:
Related Questions
Q66: Refer to Table 9-1.The firm will not
Q70: A perfectly competitive firm has to charge
Q109: A profit-maximizing monopoly produces a lower output
Q135: Microsoft hires marketing and sales specialists to
Q147: Suppose Veronica sells teapots in the
Q154: Which of the following is true of
Q241: If production displays economies of scale,the long-run
Q260: Max Shreck,an accountant,quit his $80,000-a-year job and
Q276: A monopolistically competitive firm maximizes profit in
Q285: Refer to Figure 11-3.The marginal revenue from