Figure 10-15
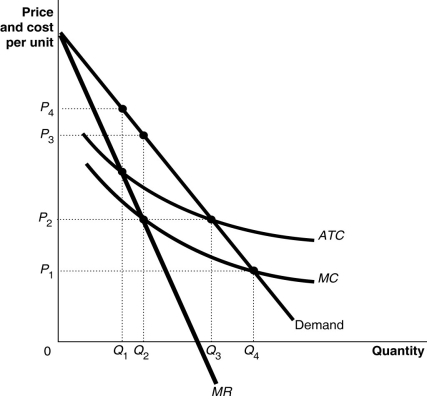 Figure 10-15 shows the cost and demand curves for the Erickson Power Company.
-Refer to Figure 10-15.Erickson Power is a natural monopoly because
Definitions:
Equity Method
An accounting technique used to record investments in which the investor has significant influence over the investee, typically through owning a large percentage of its stock.
Cost Method
An accounting method used to value an investment, based on the cost to acquire it plus any additional investments or deducting any reductions.
Impairment Loss
A reduction in the book value of an asset when its market value falls below its carrying amount on the balance sheet.
Straight Line Amortization
An approach to systematically allocate the cost of an intangible asset throughout its period of usefulness.
Q37: If the long-run average cost curve is
Q46: If a monopolist's marginal revenue is $35
Q89: In Walnut Creek,California,there are three very popular
Q90: The profit-maximizing level of output and the
Q152: If a perfectly competitive apple farm's marginal
Q246: Which of the following is not a
Q265: Refer to Figure 10-15.Why won't regulators require
Q278: If price is equal to average variable
Q331: When a monopolistically competitive firm breaks even
Q398: In the long run,firms in both monopolistically