Figure 18-2
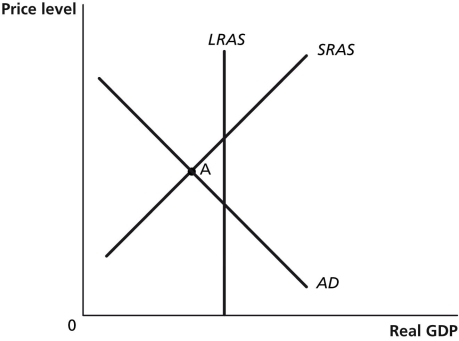
-Refer to Figure 18-2.In the graph above,if the economy is at point A,an appropriate fiscal policy by Congress and the president would be to
Definitions:
Expected Inflation
Expected inflation is the rate at which the general price level of goods and services is anticipated to rise over a specific period.
Unemployment Rate
The percentage of the total labor force that is unemployed but actively seeking employment and willing to work.
Friedman-Phelps
An economic theory associated with Milton Friedman and Edmund Phelps, focusing on the natural rate of unemployment and the relationship between inflation and unemployment.
Actual Inflation
The real rate at which the general level of prices for goods and services is rising, and, subsequently, purchasing power is falling.
Q19: The money supply curve is vertical if<br>A)
Q60: Describe the structure of the Fed's Open
Q132: Refer to Figure 19-3.What is the area
Q158: Expansionary monetary policy to prevent real GDP
Q170: What is autarky?
Q206: An economic principle that explains why people
Q229: If the federal budget has an actual
Q236: Refer to Figure 19-4.Suppose the government allows
Q241: The top policy goal for Paul Volcker
Q349: Refer to Figure 19-3.If there was no