Examine the figure below.Assume each sugar molecule represents a percentage point of sugar dissolved in the solution.Over time,the solution level on the left side of the figure would ________,while the solution level on the right side of the figure would ________.This is because the solution on the left side of the figure is ________,while the solution on the right side of the figure is ________. 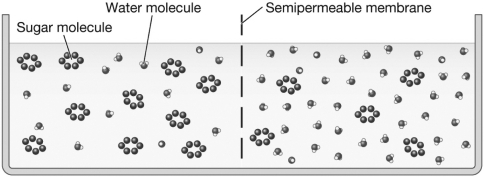
Definitions:
Contingency
An uncertain future event that could affect financial performance or outcomes.
Employee Earnings Record
A cumulative record of each employee’s gross earnings, deductions, and net pay during the year.
Withholding Tax Table
A chart used to determine the amount of tax to be withheld from an employee's paycheck based on earnings and allowances.
Payroll Register
A payroll record that accumulates the gross earnings, deductions, and net pay by employee for each pay period.
Q1: Two genes control fur color in Labrador
Q7: Ice floats on water because<br>A) the crystal
Q19: After an enzyme catalyzes a reaction there
Q22: Which of the following genetic changes would
Q28: The graph below illustrates the predicted number
Q40: Because an individual with an XX genotype
Q41: cytoskeleton<br>A)photosynthesis<br>B)regulate what moves in and out of
Q62: Kidney stones are calcium-rich crystals that form
Q72: In the Punnett square shown below,the lettered
Q74: Based on Mendelian inheritance,would it be necessary