Multiple Choice
The graph below shows the growth of a population of Paramecium caudatum.The greatest amount of daily growth occurred when the population was at approximately ________ percent of its carrying capacity. 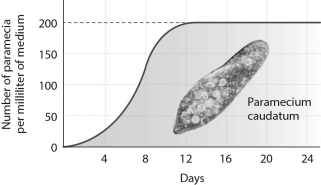
Definitions:
Related Questions
Q6: In a cohort study of smoking and
Q7: An epidemiologist decides to investigate the incidence
Q14: A bacterium that normally resides on human
Q15: Which of the following is not considered
Q49: Use examples to explain how an ecological
Q55: In some cases,science is advanced when the
Q69: A "keystone" is defined in masonry as
Q74: Contains a grid of rows and columns
Q80: What statement best describes a parasitic relationship?<br>A)
Q82: Five cereal crops provide 60 percent of