The figure given below represents the total output and price produced in an oligopoly market characterized by a dominant firm and a fringe.SF represents the supply curve of the fringe, D is the market demand curve, DRES represents the residual demand curve of the dominant firm, MRRES represents the residual marginal revenue curve of the dominant firm, and MCD represents the marginal cost of the dominant firm.
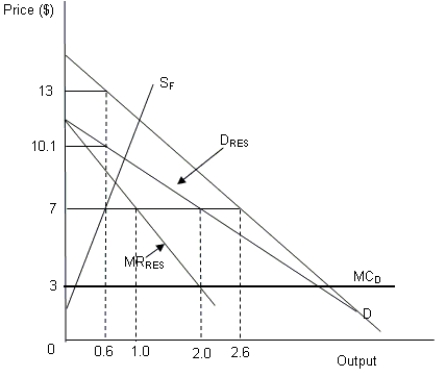
-Refer to Figure .Assume that in the long run new firms enter the market lowering the total cost incurred by the fringe firms below the same incurred by the dominant firm.Which of the following situations will arise?
Definitions:
Q3: Joanne can choose to selectively disclose information
Q4: The higher the transaction cost of an
Q5: According to the Coase theorem, if transactions
Q8: Under low-cost contracting like that between beekeepers
Q12: Which of the following is a root
Q13: Any form of wealth held by a
Q18: A packaged fruit juice manufacturer contracts with
Q40: Which of the following statements about elasticity
Q69: Transaction costs reduce the benefit accruing to
Q76: In the context of viruses, what is