The figure given below represents the total output and price produced in an oligopoly market characterized by a dominant firm and a fringe.SF represents the supply curve of the fringe, D is the market demand curve, DRES represents the residual demand curve of the dominant firm, MRRES represents the residual marginal revenue curve of the dominant firm, and MCD represents the marginal cost of the dominant firm.
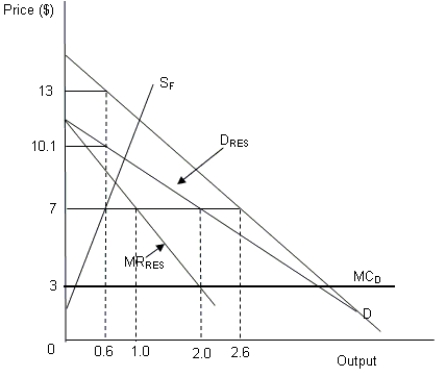
-Refer to Figure .Which of the following price and output combinations represents the overall oligopoly market equilibrium?
Definitions:
Q8: How does a dominant firm try to
Q18: A monopolist charges $7 per unit for
Q19: _ and _ are major factors in
Q21: The area above the supply curve and
Q42: An organization producing a wide range of
Q44: The owner of each share of a
Q48: Explain the concept of consumer surplus with
Q54: A hierarchy is usually a group of
Q54: If a purchase contract allows a buyer
Q63: Refer to Figure .What is the consumer