The figure given below represents the total output and price produced in an oligopoly market characterized by a dominant firm and a fringe.SF represents the supply curve of the fringe, D is the market demand curve, DRES represents the residual demand curve of the dominant firm, MRRES represents the residual marginal revenue curve of the dominant firm, and MCD represents the marginal cost of the dominant firm.
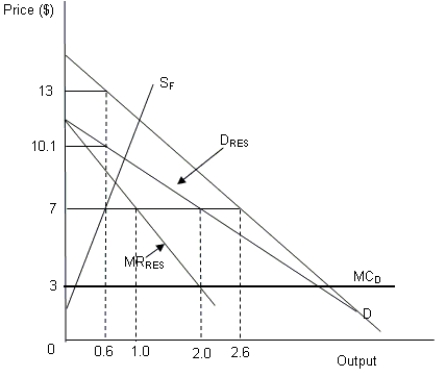
-Refer to Figure .If the supply curve of the fringe SF becomes steeper, which of the following changes will be observed in the oligopoly market?
Definitions:
Q4: Which of the following risks cannot be
Q8: The invention of the Bessemer converter in
Q15: The contact points where the terms of
Q20: Refer to Table .What will be the
Q43: A fall in demand for a commodity
Q52: What is deadweight loss?<br>A)It is the amount
Q56: Refer to Figure .Which of the following
Q59: Centralizing responsibility for a firm's investments in
Q61: How can a technician identify an action
Q66: In a market characterized by a single