The figure given below represents the total output and price produced in an oligopoly market characterized by a dominant firm and a fringe.SF represents the supply curve of the fringe, D is the market demand curve, DRES represents the residual demand curve of the dominant firm, MRRES represents the residual marginal revenue curve of the dominant firm, and MCD represents the marginal cost of the dominant firm.
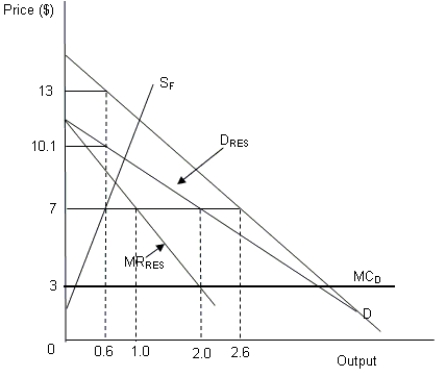
-Refer to Figure .Assume that in the long run new firms enter the market lowering the total cost incurred by the fringe firms below the same incurred by the dominant firm.Which of the following situations will arise?
Definitions:
Profit-Maximizing Quantity
The point of production where a firm reaches its maximum profit potential.
Panel
A group of individuals or experts gathered to discuss, analyze, or make decisions on specific subjects.
Intersection
The point at which two lines or paths cross each other.
Economic Loss
The difference between the cost of inputs and the revenues received from outputs, indicating a negative outcome in financial performance.
Q6: Bundling of products becomes _, if the
Q12: _ increases with the variability of outcomes
Q15: An information is beneficial to the decision-maker
Q16: How is the utility of a gamble
Q20: Joanne rents out her apartment in Seattle
Q28: Refer to Figure .What will be the
Q44: In the early twentieth century, general stores
Q44: Who is considered to be a free
Q66: Which of the following is true about
Q66: Assume that the utility function of an