The figure given below represents the total output and price produced in an oligopoly market characterized by a dominant firm and a fringe.SF represents the supply curve of the fringe, D is the market demand curve, DRES represents the residual demand curve of the dominant firm, MRRES represents the residual marginal revenue curve of the dominant firm, and MCD represents the marginal cost of the dominant firm.
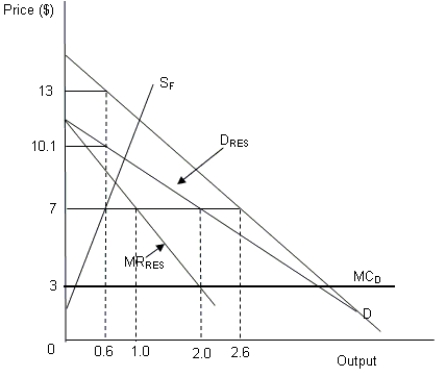
-Refer to Figure .If the dominant firm decides to maximize the present value of his future profits and threatens a price war:
Definitions:
Q7: According to the text, college students give
Q19: If the cost of production incurred by
Q29: What is port triggering?
Q32: Jeanie Reuter and Ruth Oslen are tenants
Q37: Assume that the market for executive travel
Q38: The math and graphics used in economics
Q52: In a merger, the outsider buys the
Q53: As observed in China's steel appliance market,
Q55: Which of the following observations about outsourcing
Q75: Standardized goods and services sold in the