In the figure given below, Panel A represents preexisting firms which are in long run equilibrium at price P₀ and output q₀.MC and AC represents the marginal cost and the average cost of the preexisting firms.Panel B represents a market where every seller has the smallest ability to affect prices.The market is in equilibrium at price P₀ and output Q shown by the intersection of the long-run supply curve (LRS) and market demand (D) .
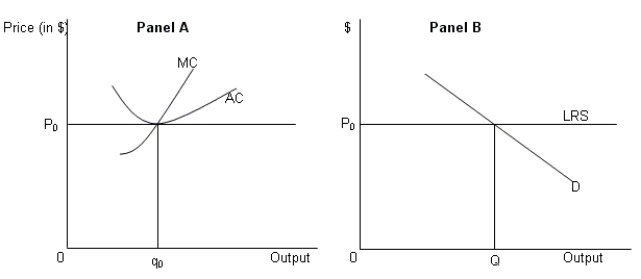
-Refer to Figure .If a preexisting firm adopts a new cost effective technology (which reduces production costs) .Which of the following changes will be observed?
Definitions:
Sales Promotion
Direct inducements offering added value or some other incentive for buyers to enter into an exchange.
Q13: Back-loading of employees' wages helps a company
Q26: In an industry, when the cost curve
Q30: The production function shows:<br>A)the total cost incurred
Q32: Which of the following statements is true
Q41: The introduction of new technology and changes
Q48: Explain the three dimensions of uncertainty which
Q50: Which of the following can be a
Q56: Suppose the cost of raw materials used
Q59: Which of the following can act as
Q65: Refer to Figure .Calculate the profit earned