In the figure given below, Panel A represents preexisting firms which are in long run equilibrium at price P₀ and output q₀.MC and AC represents the marginal cost and the average cost of the preexisting firms.Panel B represents a market where every seller has the smallest ability to affect prices.The market is in equilibrium at price P₀ and output Q shown by the intersection of the long-run supply curve (LRS) and market demand (D) .
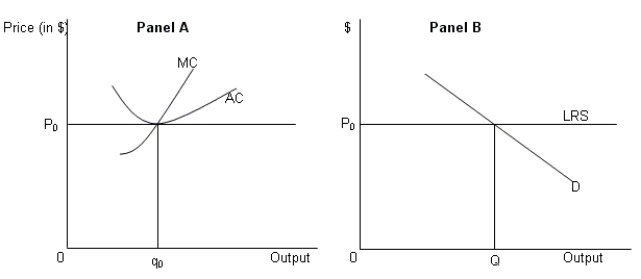
-Refer to Figure .Suppose some of the preexisting firms adopt the cost effective technology of the innovator while non-adopters that are incurring losses shut down.The high cost sellers produce the rest of the market output.What will happen to the equilibrium price level?
Definitions:
Ecological Systems Model
A framework used in social and behavioral sciences that depicts how individuals interact with their various environments, from immediate surroundings to broader societal levels.
Diversity and Difference
The range of distinct characteristics, cultures, and experiences among individuals in a group or society.
Cultural Education
The process of teaching and learning about different cultures and their customs, values, and traditions.
Prevention
Strategies or actions taken to stop something undesirable, such as illness or adverse events, from happening.
Q7: Assume that recent oil exploration coupled with
Q13: Refer to Figure .What impact will the
Q14: Which of the following products witnessed a
Q20: Carla had received very low annual return
Q20: Refer to Table .What would be the
Q22: The inability of client to monitor the
Q35: The late business historian Alfred Chandler blamed
Q43: Identify and define the different types of
Q57: What are property rights?
Q65: Refer to Figure .Calculate the profit earned