The figure given below represents a perfectly competitive market in long-run equilibrium.LRS represents the long-run supply curve of this market with demand (D) and price $50.When two large firms merge, output declines to 400 units and per unit production cost drops to $30.
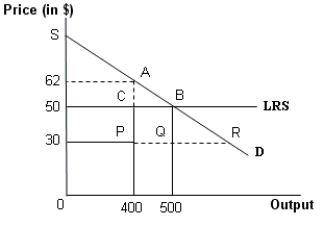
-Refer to Figure .Calculate the value of the deadweight loss resulting from the horizontal merger?
Definitions:
Clayton Act
A piece of U.S. legislation enacted in 1914 aimed at promoting competition among enterprises and preventing monopolies by outlawing certain anti-competitive practices.
Sherman Act
A landmark federal statute passed in 1890 aimed at promoting competition among businesses by prohibiting monopolies and other activities that restrained trade.
Clayton Act
A U.S. law enacted in 1914 aimed at promoting competition by preventing mergers and acquisitions that could significantly reduce market competition.
Tying Contracts
Agreements where the seller conditions the sale of one product on the purchase of another product.
Q3: Which of the following statements about Coasian
Q6: Refer to Figure. The area EFGH is:<br>A)the
Q16: Assume that there are two types of
Q23: Which of the following is NOT an
Q38: In case of a disagreement between a
Q39: Centralizing decisions is efficient if people at
Q49: Food retailers usually do not compete on
Q51: A monopolist who attempts to bundle her
Q55: A contract can help a seller to
Q55: In an ascending value auction, a bidder