The figure below shows the supply and demand curves for oranges in Smallville. 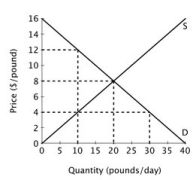 When this market is in equilibrium, total economic surplus is ________ per day.
Definitions:
Barriers to Entry
Factors that prevent or hinder companies from entering a specific market or industry, including high startup costs, strict regulations, and established competition, which can protect existing firms from new entrants.
Artificial Differences
Distinctions created or imposed in a situation or between objects that do not naturally or inherently exist.
Horizontal Differentiation
A strategy where products are made different from those of competitors on aspects other than price, such as quality or features, while aimed at satisfying the same basic need.
Product Mix
The variety of products a company offers for sale to meet market demand and enhance profitability.
Q26: The market for bagels contains two firms:
Q45: Consider the accompanying payoff matrix. <img src="https://d2lvgg3v3hfg70.cloudfront.net/TB6547/.jpg"
Q56: Refer to the accompanying table. The law
Q61: If the percentage change in quantity demanded
Q63: Average total cost is defined as:<br>A)total cost
Q81: Which of the following is the most
Q105: Given the total cost function TC =
Q111: Suppose that when a perfectly competitive firm
Q148: If there is excess demand in a
Q154: Which of the following is NOT a