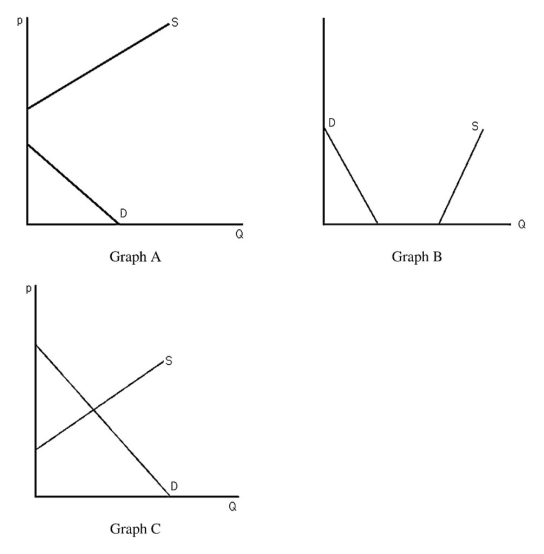
-The above figure shows three different supply-and-demand graphs.Which graph best represents the market for vacations on Mars?
Definitions:
Demand Schedules
A table that shows the quantity of a good that consumers are willing and able to purchase at various prices, holding all else constant.
Demand Curve
A graphical representation of the quantity of a good that consumers are willing and able to buy at different prices.
Price Change
A variation in the cost of a good or service over time.
Technology Improvement
The enhancement or development of new technologies or the improvement of existing technologies, which can lead to increased efficiency and productivity.
Q36: A country produces cars and books.All of
Q37: Virtual teams report higher levels of participation,higher
Q55: The above figure shows the demand curve
Q64: If pizza and tacos are substitutes,a decrease
Q71: Explain why when the demand curve for
Q84: Lionfish is an aquatic invasive species in
Q85: Indifference curves cannot ever be concave for
Q93: An optimal choice in which a consumer
Q117: Were it not for the law of
Q126: The military is NOT a perfectly competitive