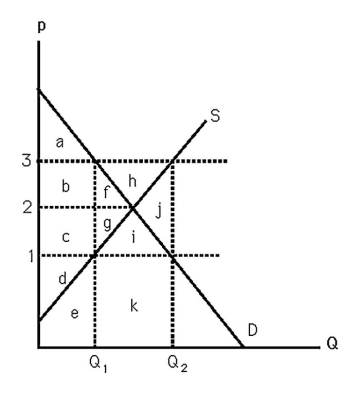
-The above figure shows supply and demand curves for milk.In an effort to help farms,the government passes a law that establishes a $3 per gallon price support,but allows farmers to decide how much milk to produce.The government then provides a deficiency payment to guarantee that the farmers receive $3 per gallon.The welfare loss of this price support is
Definitions:
Marginal Cost Curve
A curve that graphically represents the cost of producing one additional unit of a good, typically illustrating how marginal cost varies with the quantity produced.
Competitive Firm
A company operating in a market where it has to set its prices based on the market conditions because it has little to no influence over the market prices.
Output Rises
An increase in the amount of goods or services produced by a company or economy.
Negative Economic Profit
A situation where total costs exceed total revenues, indicating a loss in economic terms.
Q27: The above figure shows the market for
Q29: What is the change in the producer
Q30: In spring 2008,the U.S.Congress proposed to tax
Q30: The above figure shows the reaction functions
Q99: A monopoly faces an inverse demand curve
Q100: Suppose a consumer advocacy group has convinced
Q101: The above figure shows supply and demand
Q103: Suppose the production possibilities for two countries,producing
Q110: Suppose Cournot duopolist firms operate with each
Q133: A monopoly does not have a supply