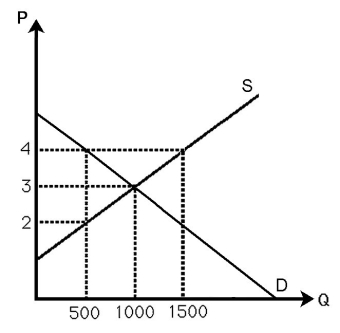
-The above figure shows the demand and supply curves in the market for milk.Currently,the market is in equilibrium.If the government imposes a $2 per gallon tax to be collected from sellers,calculate the dead weight loss associated with the tax,and explain why the dead weight loss occurs.
Definitions:
Q19: The above figure shows the demand and
Q20: The above figure shows supply and demand
Q31: If the government regulates the price a
Q33: Many universities have either a top football
Q63: Suppose a farmer in a perfectly competitive
Q88: At the current price of a good,Jessica's
Q95: A monopolist faces the inverse demand curve
Q114: Why doesn't a firm price discriminate based
Q136: A firm that generates zero economic profit
Q144: The above figure shows the market for