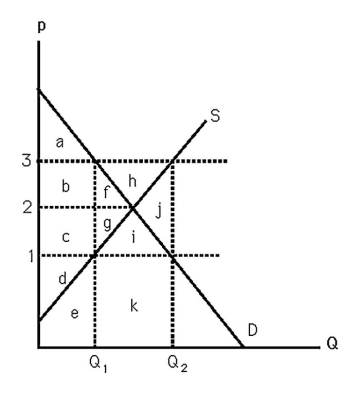
-The above figure shows supply and demand curves for milk.If the government passes a $2 per gallon specific tax,the loss in social welfare will equal
Definitions:
Short-Run Supply
The total quantity of goods and services that producers are willing and able to sell at current prices in a short-term period, often influenced by fixed production capacities.
Long-Run Supply
The total amount of a product or service that is available to the market from all producers over a long period, when all inputs can be adjusted.
Purely Competitive
An idealized market structure in which there are many buyers and sellers, no barriers to entry or exit, and perfect information, leading to prices being determined by supply and demand.
Market Supply Curve
A graphical representation showing the total quantity of a good that sellers are willing and able to sell at various prices, holding all else constant.
Q21: Sheri is currently purchasing 10 units of
Q38: A cheese-by-mail club that charges an annual
Q42: The learning curve is the relationship between<br>A)
Q60: If a competitive firm is in short-run
Q64: Which of the following market structures have
Q74: If a firm operates in a perfectly
Q87: Assume a company can offer customers cable
Q89: There are only two firms in an
Q91: Over a five-year span,the ABC Co.reduced the
Q119: If the inverse demand curve a monopoly