Multiple Choice
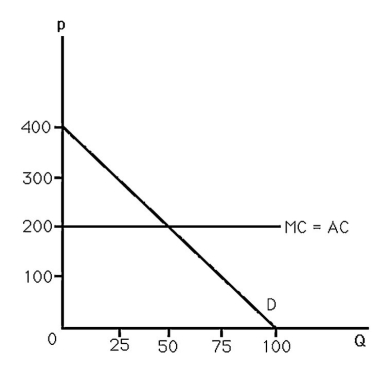
-The above figure shows the demand and cost curves facing a monopoly.The monopoly maximizes profit by selling
Definitions:
Related Questions
Q3: As opposed to general equilibrium analysis,partial equilibrium
Q11: Explain why a government may select an
Q17: In the Stackelberg model,the leader has a
Q32: When a firm uses a form of
Q60: If a competitive firm is in short-run
Q61: The marginal cost curve intersects the average
Q74: If a firm operates in a perfectly
Q89: Explain why advertising that results in spuriously
Q90: Suppose the demand for pizza in a
Q132: The owners of sports franchises often complain