The figure given below depicts the foreign exchange market for British pounds traded for U.S.dollars. Figure 22.2 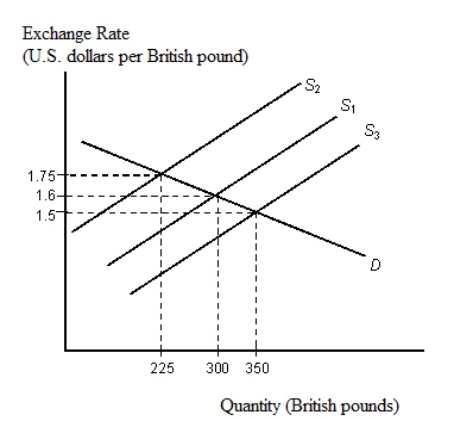
- Refer to Figure 22.2.Suppose S1 is the initial supply curve and the British demand for U.S.manufactured computers decreases.Then,with flexible exchange rates:
Definitions:
Equilibrium Quantity
The amount of goods or services that are bought and sold at the equilibrium price, where market demand meets market supply.
Consumer Surplus
The discrepancy between the total sum consumers are prepared and able to spend on a good or service and what they ultimately pay.
Equilibrium Price
The market price at which the quantity of goods supplied equals the quantity of goods demanded.
Equilibrium Quantity
The quantity of goods or services supplied that equals the quantity demanded at the market equilibrium price.
Q28: In Figure 21.2,if the world price
Q28: What does the clash of civilizations hypothesis
Q34: When President Bush commuted a 30-month jail
Q42: Why does the demand curve for human
Q56: Recent courts have been less willing to
Q59: Countries should specialize and import goods in
Q61: Why is the retirement of the baby-boom
Q72: If the average costs of production decline
Q81: Refer to Scenario 20.2.Ghana will be willing
Q81: Members of Congress often resist taking action