The figure given below depicts the negatively sloped demand and positively sloped supply curves of wheat in a country. Figure 21.2 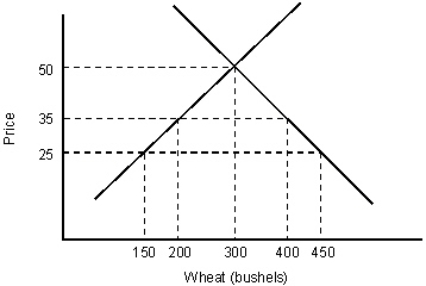
- In Figure 21.2,if the world price per bushel of wheat is $25,and a tariff of $10 is imposed,what is the domestic production?
Definitions:
Q3: On account of a massive construction boom
Q20: Refer to Scenario 20.1.Calculate the opportunity cost
Q32: The income variation across the countries is
Q35: If coal is extracted in an unsustainable
Q40: One of the surest signs that the
Q55: According to strategic trade policy,international trade largely
Q57: The guaranteed transfer income of Angela's family,which
Q69: Agreements to abolish most barriers to trade
Q77: What was the principal effect of Marbury
Q92: If prices rise within a country,then,other things