The figure below shows the demand (D) and supply (S) curves of corn syrups. Figure 21.3 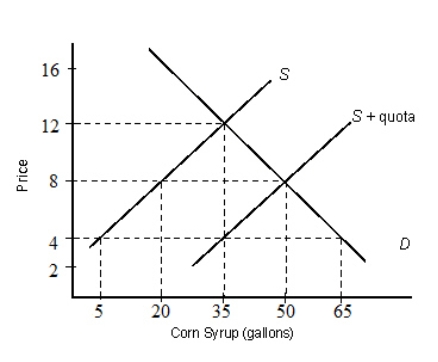
-In Figure 21.3,with an import quota of 30 gallons of corn syrup,what is the new equilibrium quantity demanded?
Definitions:
Downsloping
A term describing a downward trend or decrease, often used in economics to refer to declining prices or demand curves that slope downwards as price increases.
Nominal Interest
is the stated interest rate of a loan or financial product, not adjusted for inflation, representing the face value of the interest charged or earned.
Capital Good
Long-lasting goods that businesses use to produce goods and services, contributing to their productive capacity.
Rate Of Interest
The percentage charged on the total amount of borrowed money or paid on invested capital.
Q3: The 1972 Strategic Arms Limitation Treaty, which
Q17: The Bretton Woods System of exchange rates
Q27: Steel producers in the United States observe
Q34: In Figure 19.2,the richest 20 percent of
Q37: What are the earnings of a resource
Q59: If the coupon-rate of a particular bond
Q64: Refer to Figure 20.1.If the price
Q69: Refer to Scenario 20.1.Which of the following
Q71: The U.S.policy of containment during the Cold
Q86: The export supply curve shows a country's:<br>A)domestic